

Software
SpotOn Survey System
The simple solution to a difficult problem, synchronised data acquisition and automated reporting at the touch of a button.
SpotOn 3
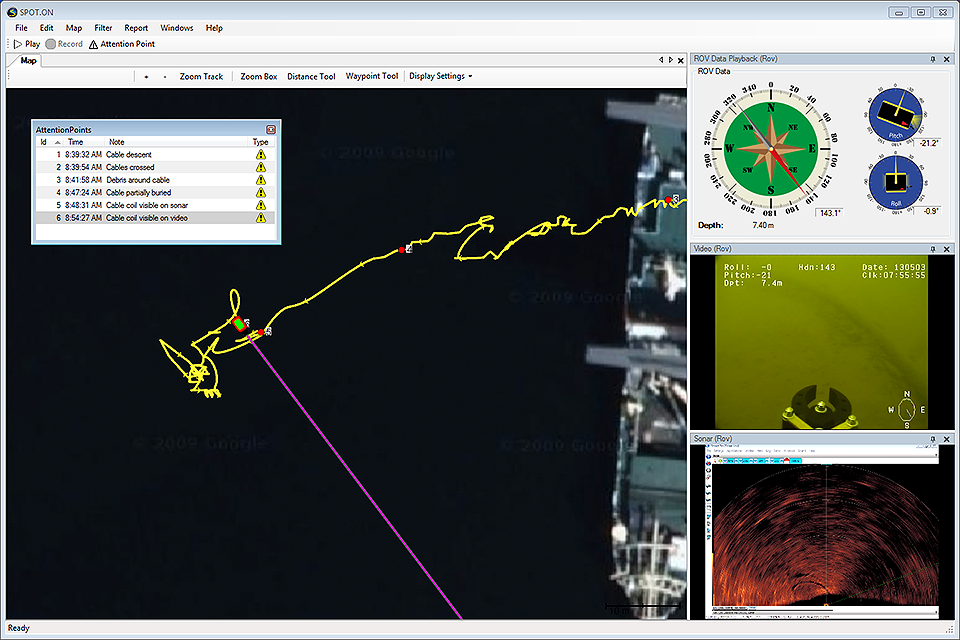
SpotOn 3 is a patented survey management software which allows operators to supervise, manage and collect synchronized geographic position, video, sonar and serial data in virtually any type of survey environment. Although SpotOn was originally designed for underwater use, it is ideal for recording any type of georeferenced data.
Collected data is connected to a track overlay on a drawing, map or chart. Any part of the recorded data is instantly viewable and playable by simply clicking the track. Points of interest are automatically presented in an automated report. Of course, the full survey, including all video and other collected data, can be shared and played back in the freely available SpotOn Viewer.
Simple and fair licensing
Simple licensing terms allows installation on multiple computers and transfer of the license between them without manual activation or an Internet connection.
The license is provided as a USB License Key, the computer with the key inserted into a USB port is the currently licensed computer.
An unlicensed installation will function as the freely distributable SPOT.ON Survey Viewer. Please keep in mind that to run the full version of SPOT.ON, the installed release must match the SPOT.ON USB License Dongle.
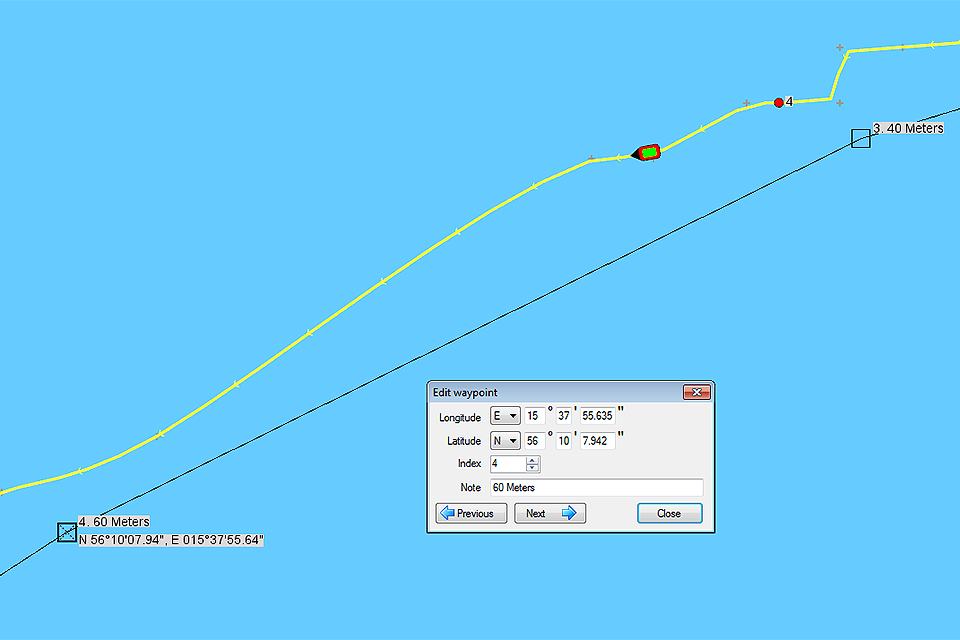
SpotOn waypoints module
The Waypoints Module is used to quickly and easily plot or modify a survey plan. Coordinates can be added from a data file, entered as lat/long or clicked out and then move using drag-and-drop.
SpotOn cruise control module
The Cruise Control Modules ties together SPOT.ON Waypoints, an underwater position system and a Doppler Velocity Log (DVL) with the V8 ROV Control API to provide entirely autonomous ROV operation, including dynamic positioning and station-keeping.
Of course the pilot has the option to override or modify the set operation plan manually, or change the plan during operation as required.
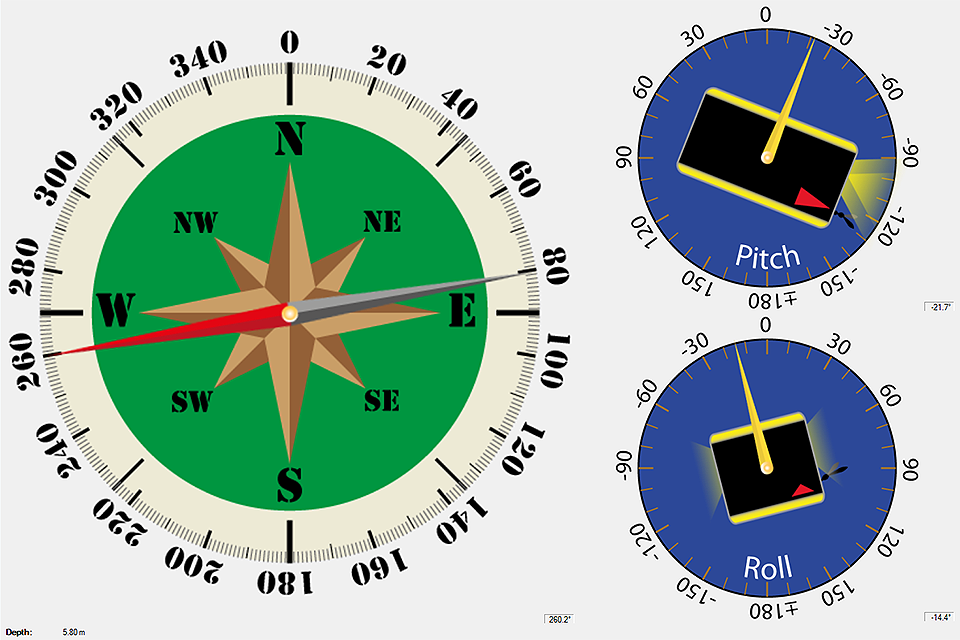
Graphical sensor data acquisition module
SpotOn contains support for graphical display, data acquisition and playback of different types of data, including the heading, pitch, roll and depth telemetry from the Ocean Modules V8 range of ROV systems.
General serial data acquisition module
SpotOn can collect, display and report any type of serialised data straight out of the box thanks to the General Serial Device module, through any RS232 or USB converter interface. The General Serial interface is commonly used for altimeters, sound velocity sensors, spectrophotometers and CTD instruments.
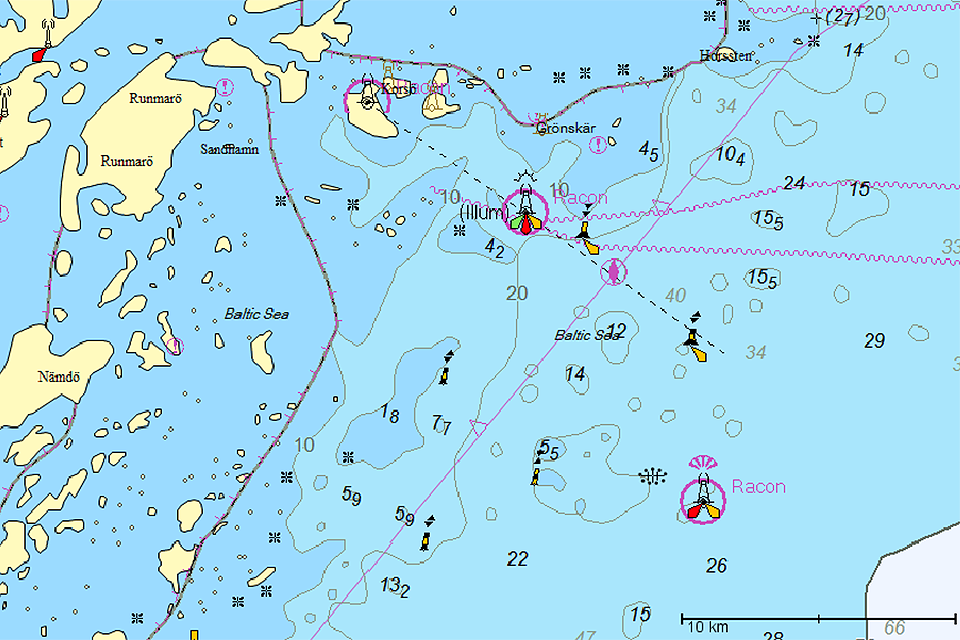
Jeppesen C-map digital sea charts
C-MAP is the standard that ushered in contemporary digital charting. One of the most reliable chart options for boaters worldwide, C-MAP charts continue to deliver exceptional quality and value to navigators worldwide. C-MAP electronic charts offers the same reliable navigation detail easy-to-use features you expect in all C-MAP by Jeppesen products.
Support for Jeppesen C-MAP digital charts is included with every SPOT.ON license. Chart data for specific coverage areas can be purchased through Ocean Modules.
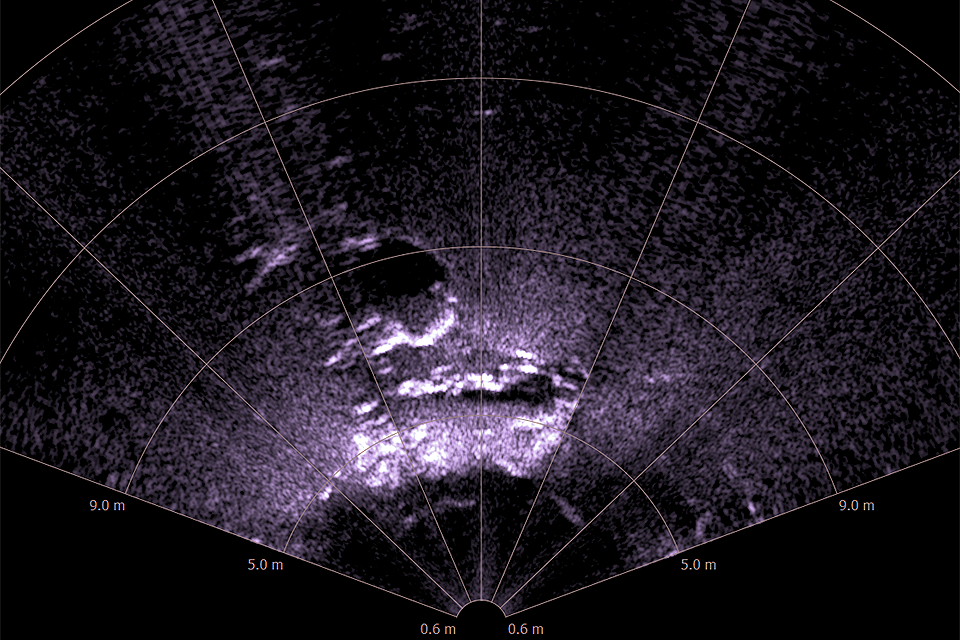
Screen-capture data acquisition module
Support for full-resolution recording of screen-based applications, such as multibeam sonar, is provided through the SPOT.ON Hardware Kit.
Examples of applications commonly used with the V8 range of ROV systems and the SPOT.ON software include the Norbit Forward Looking Sonar, the BlueView 900-2250-45 (Dual Frequency) Sonar and the Tritech Micron Sonar, but of course any application from any manufacturer will work out of the box without any software integration at all.
Blueview Dual Frequency Sonar
Tritech Micron Sonar
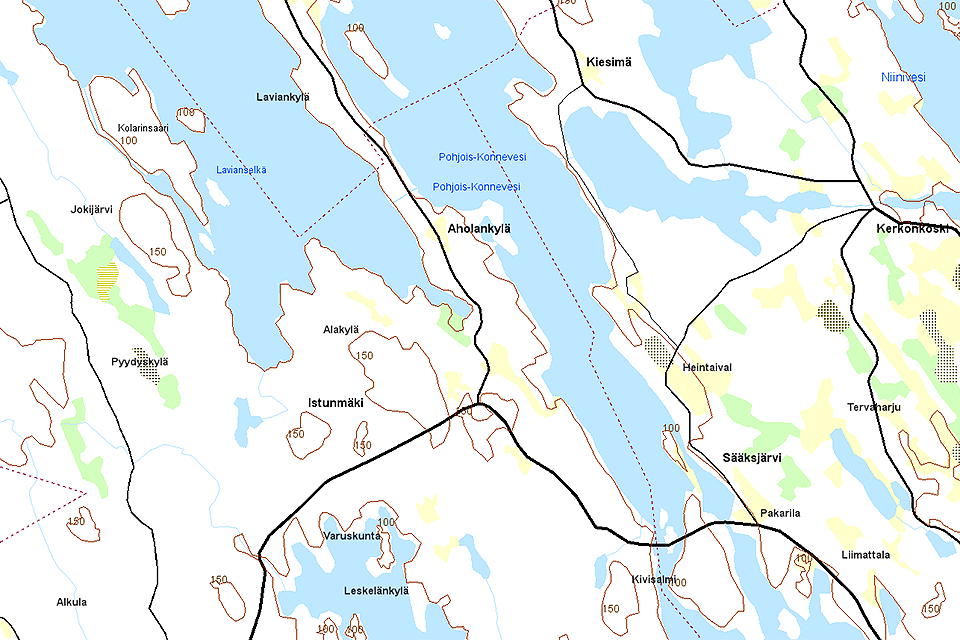
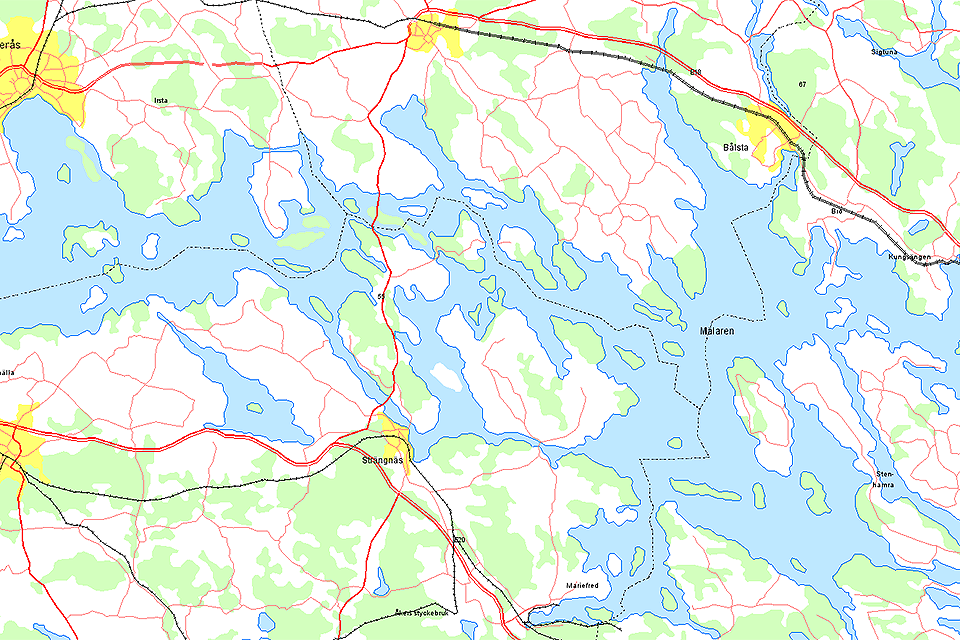
Multilayer raster/vector maps and charts
A wide variety of charts and maps available online, often free of charge, from various national land survey agencies. Such charts and maps can easily be implemented in SPOT.ON based on customer requirements.
The slideshow above demonstrates how SPOT.ON displays three levels of detail of Finland. First an overview vector map to 1:1000000, then a more detailed 1:100000 vector map and finally a highly detailed 1:50000 raster map, are loaded dynamically into the chart view depending on the current zoom level.
Swedish national land survey agency
Finnish national land survey agency
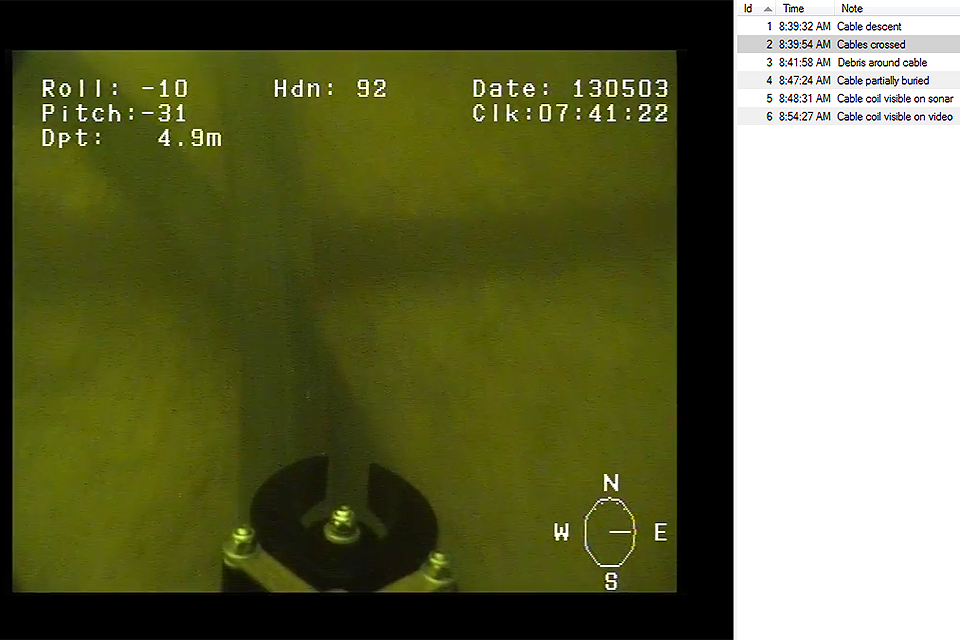
Video acquisition module
Video data acquisition is one of the core modules at the heart of many SPOT.ON surveys. Like all other sensors, video data is recorded, timestamped and linked to geographic position data, allowing the synchronised playback and reporting capabilities that make SPOT.ON such a remarkable survey system.
SPOT.ON supports many different video acquisition interfaces through Microsoft DirectShow. A well-tested and capable video recording hardware interface is provided through the Ocean Modules SPOT.ON Hardware Kit.
SPOT.ON attention points
SPOT.ON Attention Points are used to mark points of interest during a survey, and are the framework upon which the automatic reporting functionality of SPOT.ON is based.
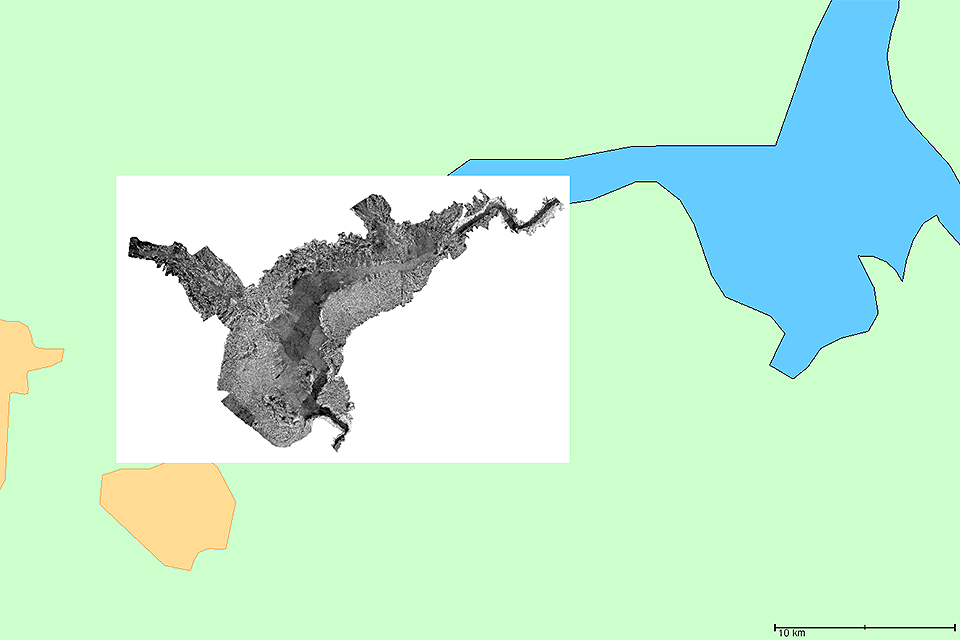
GeoTIFF support
SPOT.ON is delivered with support for a variety of GeoTIFF standard formats. This means that any type of satellite imagery, drawing, side-scan sonar data, bathymetry data or other type of georeferenced image can be used as a map/chart.
GeoTIFF images can be generated using QGIS, a user friendly geographic information system which runs on Linux, Unix, Mac OSX, Windows and Android. QGIS supports numerous vector, raster, and database formats and functionalities.
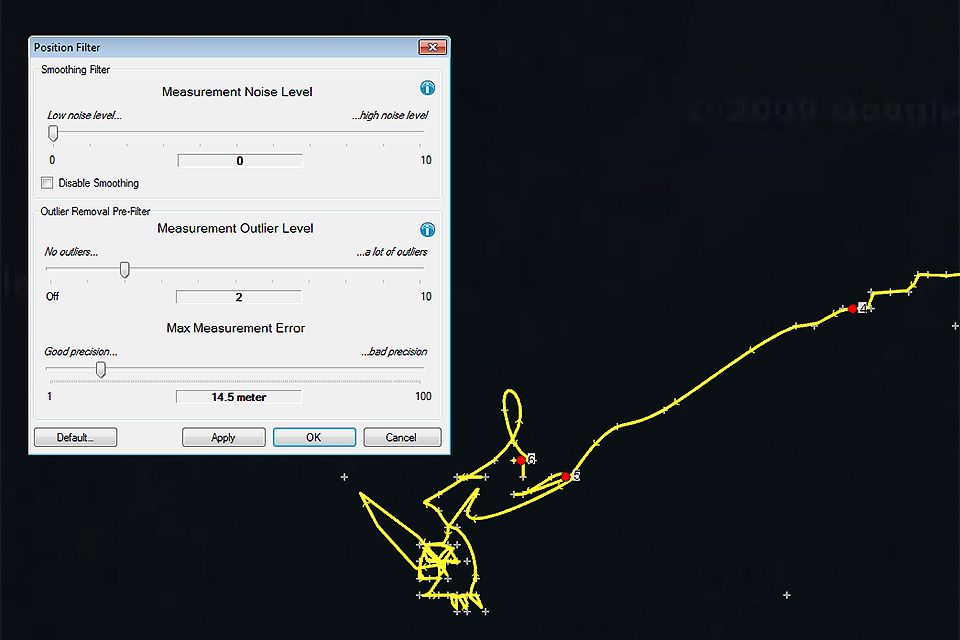
Dynamic filtering module
The filtering module built-in to SPOT.ON is based on advanced Kalman and dynamic outlier removal technology. Filtering makes it easy to create reports containing realistic tracks based on GPS or underwater positioning system data that may be inaccurate, noisy or of low resolution.
Several different display options, including the raw data points, a track based on only the raw data, only the filtered track or the filtered track and the raw data points provide flexible reporting options.
A simple interface consisting of only three sliders makes it extremely easy to experiment with different settings to find the perfect filtering display for each individual application.
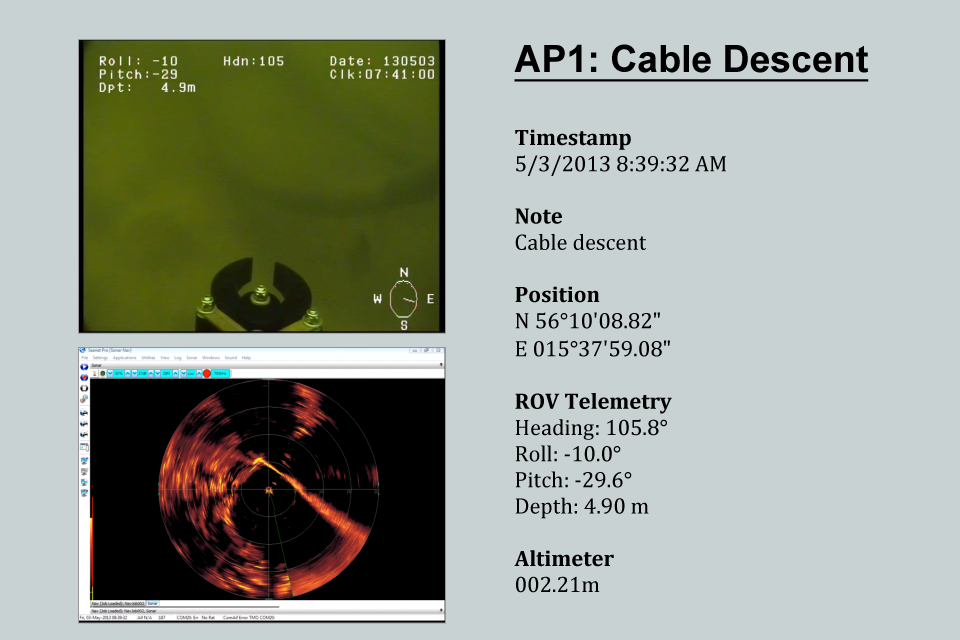
SPOT.ON automatic reporting
The end product of a SPOT.ON survey is always the report.
Although it is possible to replay the entire survey in different speeds forward or in reverse, jump dynamically using geographic position by clicking the track, timestamp by dragging the timeline or points of interest through the Attention Point interface, many times a client will only want a printed report.
An automatic report based on the set Attention Points can be generated at any time during the survey. This means that a PDF report can be sent to the client immediately, without any manual work at all.
Export to Microsoft Word format ensures compatibility and the capability to edit reports, change the style or paste parts of the report into another document.
Custom maps and charts
Nautical chart extensions can be activated for high-performance reading and rendering of maritime data according to the IHO S-57 and S-52 standards.
Customer-specific extensions can be made available for a wide variety of formats, including ADRG, ARINC, ASRP, AutoCAD DXF, AutoCAD DWG, BIL, BSQ, BSP, BSB Nautical, CADRG, CEOS (Spot), CIB, CMRG (PCMap), DEM, DFAD, DTED, ECW, ELAS, Envisat N1, ESRI Shape, ESRI Shape 3D, ESRI Binary ADF, ESRI ASCII Grid, Erdas IMG, Erdas LAN/GIS, GeoSoft raster, GridASCII, HDR, Intergraph raster, Japanese DEM, MapInfo TAB, MapInfo MIF, MFF, MFF2, MrSID, MySQL, NITF, NOAA, Oracle Spatial, OGC WMS, OGC WCS PolGASP, Raw, RPF, SDTS DEM, SQL Server 2008, USGS ASCII, USGS DOQ, USRP, VTP BT elevation, VPF, SRTM HGT, WMO GRIB1 and WMO GRIB2.
Interested in purchasing SPOT.ON?
Get in touch